jQuery Visualize Plugin
jQuery Visualize Plugin is the perfect plugin if you have a table and want to generate a chart out of it. It offers different types of charts such as Bar, Area, Pie & Line charts.
Examples
Type of Charts: Bar, Area, Pie & Line.
Requirements: jQuery, excanvas (included)
Browser Support: IE6*, IE7*, IE8*, Firefox 2, Firefox 3.5, Safari 3 and 4, Opera 9.
* HTML 5 canvas element is not supported by IE but Google maintains a library that translates canvas scripting into VML, allowing it to work in all versions of internet explorer.
Demo: http://www.filamentgroup.com/examples/charting_v2/index_2.php
License: MIT and GPL licenses
- http://www.filamentgroup.com/examples/jqueryui-visualize/
- http://www.filamentgroup.com/examples/jqueryui-visualize/vanilla.html
- http://filamentgroup.com/dwpe/#codeexamples
Highcharts
Highcharts is a really impressive jQuery Chart Library. In a few words, Highcharts is compatible with most browsers and even iPhone; numerous chart types are supported; it is a dynamic plugin because you can add, remove and modify series, axes or points at any time after chart creation and you can load data from external files; tooltip labels are also supported which is great for detailed information in a point of a chart; zooming and last but not least all text labels can be rotated in any angle.
Examples
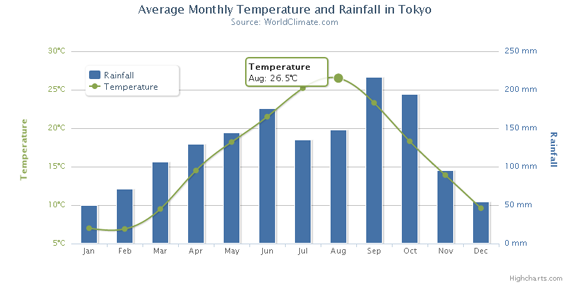
Line and column example

Columns with rotated labels
Type of Charts: Bar, Area, Areaspline , Pie, Line, Spline, Column & Scatter.
Requirements: jQuery or MooTools
Browser Support: IE6, IE7, IE8, Firefox 2, Firefox 3.5, Safari 3 and 4, Opera 9 and iPhone!
Demo: http://www.highcharts.com/demo/
License: Creative Commons Attribution Non-Commercial 3.0 License. Free for personal website, a school site or a non-profit organization. For a single commercial Website the license costs $80.
Flot
Flot is as the authors call it an “Attractive Javascript plotting for jQuery”, which is true. The charts look simple and nice; it is easy to create charts and all settings are optional. Some key features of plot is turning series on/off, zooming, interacting with the data points and it integrates a simple tooltip feature.
Examples
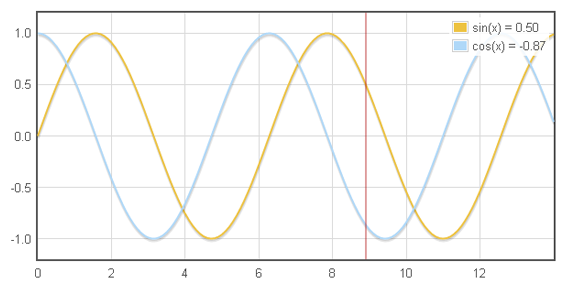
Tracking curves with crosshair plugin
Type of Charts: Bar, Area, Point & Line.
Requirements: jQuery
Browser Support: IE6, IE7, IE8, Firefox 2, Firefox 3.5, Safari 3 and 4, Opera 9 and Konqueror 4+.
Demo: http://people.iola.dk/olau/flot/examples/
License: MIT License
jQuery Sparklines
Sparklines generates small inline charts either inline in the HTML or via JavaScript. It is really good for displaying mini graphs notably because most of them just take 1 line of HTML or JavaScript code. Another great feature is it self-refreshing capabilities. You can see it in their Mouse-Speed demo which shows you the power of live charting.
Example
Type of Charts: Bar, Tristate, Bullet, Box Plot & Line.
Requirements: jQuery
Browser Support: IE6, IE7, IE8, Firefox 2, Firefox 3.5, Safari 3 and 4, Opera 9 and Google Chrome.
Demo: http://omnipotent.net/jquery.sparkline/
License: New BSD License
jqPlot
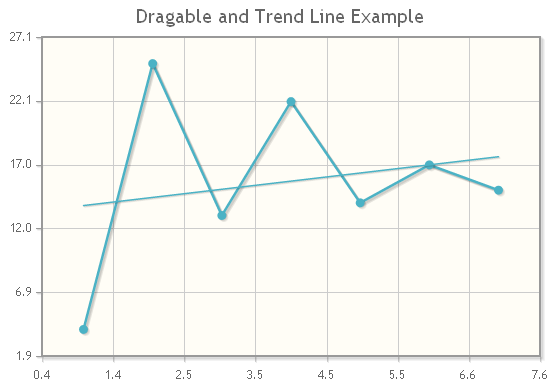
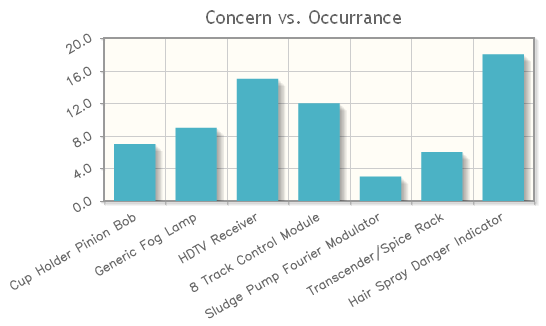
jqPlot did not catch my eye at first glance but after further research I found it to be one of the best and free jQuery chart library. Numerous graphical options are available you can even add shadows and interact per drag&drop in the charts! It even automatically computes trend lines. We could compare it to highcharts in terms of features and functionality.
Examples
Type of Charts: Bar, Pie & Line.
Requirements: jQuery
Browser Support: IE6, IE7, IE8, Firefox 2, Firefox 3.5, Safari 3 and 4, Opera 9 and Google Chrome.
Demo: http://www.jqplot.com/tests/
License: MIT and GPL version 2 licenses
- http://www.jqplot.com/tests/bar-charts.php
Google Chart
https://developers.google.com/chart/?hl=ko&csw=1
https://google-developers.appspot.com/chart/interactive/docs/gallery/columnchart
jpgraph
http://jpgraph.net/features/src/show-example.php?target=new_bar1.php
jqchart (일본사이트인듯)
http://jsgt.org/lib/jquery/plugin/jqchart/sample/v003/test-use-gradient.html
tufte-graph
'Story > Jquery' 카테고리의 다른 글
| jQuery Plugin For Auto Resizing iFrame - iFrame Resizer 아이프레임 리사이즈 (0) | 2014.03.05 |
|---|---|
| jquery 배열 형태의 id 값 사용하기 (0) | 2014.01.28 |
| jQuery Marquee (0) | 2013.08.05 |
| 이미지맵 image map 확인 (0) | 2013.08.05 |
| Multi-line Text Overflow Ellipsis (0) | 2013.08.05 |